July 28, 2012 | Graham

What is the truth on Qld Labor’s record of deficit and the GFC?


I was taken by surprise when Cameron Dick claimed on our last Friday morning meeting on Steve Austin’s ABC 612 morning program that Labor had produced surpluses for 7 of its last 10 budgets. Could this be true?

I disputed the claim, but without conviction. Cameron is a person of substance. I didn’t think he would have made the figure up. But it didn’t square with what I understood the case to be.

Further he asserted, as Labor has been asserting for some time, that the extra expenditure was a response to the global financial crisis.

So I’ve investigated both claims, and Cameron is wrong on the first count. On the second he might be right, but if so, it is one of the more inept and ineffective responses to the GFC.

What’s more, he’s guilty of trying to frame the debate to put a good spin on Labor’s record.

I won’t be backward in challenging next time.

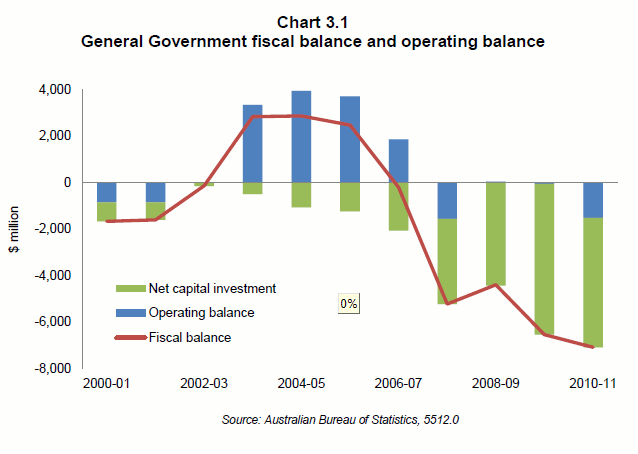
The graph below is from the Costello Commission of Audit. It shows the operating surplus and the fiscal balance between 2000-01 and 2010-11. Note that there is no 10 year period that contains seven surpluses. Added to that, the deficit for the 2011-12 year was forecast at -$4,058,000,000 by the former government, followed by $1,293,000,000 the next year.

Queensland Budget Balances since 2001-01 per ABS and reproduced in Costello Commission of Audit

Note also that the fiscal balance is much less flattering to the previous government, and that it started deteriorating a year and a quarter before Anna Bligh became Premier of Queensland, but in a period when she was the Treasurer, and then accelerated markedly during her first years, and that her legacy is deficits into the foreseeable future.

Citing performance over the last ten years is like trying to drive forward using your rear view mirror – only reassuring if you don’t know what you are doing.

This graph also demonstrates that Cameron was wrong on his claims about the GFC. As far as most of us are concerned the GFC dates from the crisis at Lehman Brothers which saw it file for bankruptcy on 15 September 2008.

But the big deterioration in the budget occurred before that, and in fact government expenditure in the 2008-09 year was less than the previous year – some stimulus.

Expenditure was higher in 2009-10 and 2010-11, but by this stage the economy had recovered from the GFC.

If the increase in the deficit was meant to deal with the GFC it was incompetently applied.

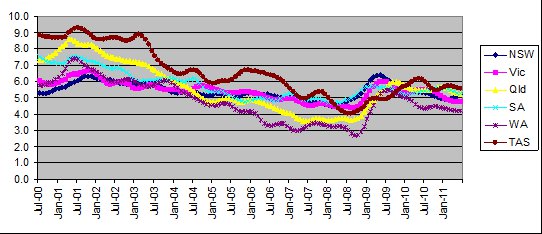
Not only that, but if it had an effect on unemployment it may well have been negative. The graph below is compiled from ABS data in their series 6202.0.

Australian unemployment rates by state between 2000 and 2011

Queensland entered the GFC with an unemployment rate second only to WA, and it is now vying with the basket case economy of Tasmania for the worst.

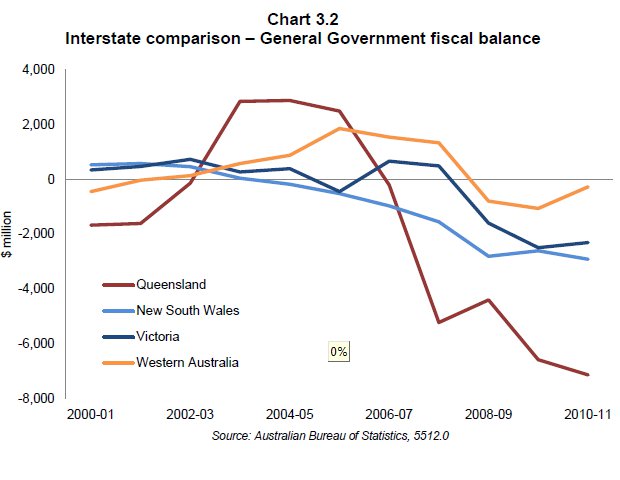
Maybe we needed to borrow more? Nope. The graph below shows that Queensland has out-borrowed, by a huge margin, all the other states. You know, the ones with a better performance on unemployment.

Fiscal balances of Australian States between 2000 and 2011

So please Cameron, can we stick to the facts next time?


Posted by Graham at 11:57 pm | Comments (14) |
Filed under: Uncategorized

July 24, 2012 | Ronda Jambe

Caravaggio can wait


Try to pin this one on solar cycles or conspiracy theories. A wide range of 
scientists note the high temps in the US. (see link below) The back story
includes a meagre corn crop for the US, with implications for food prices 
globally. 

It must be heat stress that leads me to link the most recent mass murder
in the US to their distorted gun and military economy/culture. But why do 
I meet so many Americans that agree? The would like to see the money spent
on addressing infrastructure and climate change mitigation.

They are fellow travellers on a cruise of the eastern Mediterranean, where 
temperatures in Athens hit 40C, far too much to stimulate appreciation of their 
wondrous cultural heritage. Too hot and too little wifi to add pics, maybe next
time. 
Prediction: within 10 years tourism in Europe will be impacted by climate 
change, adding to the turmoil. I won't be back in the summer months. I've
 been chasing Caravaggio paintings with great pleasure around Italy and Malta. 

While I was off on my quest my spouse got caught up inadvertently in a brawl 
in a Naples cafe between an African bag seller and his Neapolitan supplier. result: 
broken eyeglasses and a surprised spouse, no more wifi for him that day. 

What a great combination: desperate economic refugees plus the Comorra. 
Imagine what climate change will bring to that mix? Why do you think 
they are flowing out of Africa anyway?

to the point:
  U.S. EXPERIENCES WARM AND DRY JUNE; DROUGHT EXPANDS TO 56% OF LOWER 48
The average temperature for the contiguous U.S. during June was 71.2°F,
2.0°F above the 20th century average, ranking as the 14th warmest June on
record. Scorching temperatures during the second half of the month broke or tied
over 170 all-time temperature records in cities across America. June temperatures
also contributed to a record-warm first half of the year and the warmest 12-month
period the nation has experienced since recordkeeping began in 1895.
-- full story > http://www.sciencedaily.com/releases/2012/07/120720205544.htm


Posted by Ronda Jambe at 8:00 pm | Comments Off on Caravaggio can wait |
Filed under: Uncategorized

July 12, 2012 | Graham

More accurate dendrochronology straightens hockey stick


A new proxy reconstruction of the last two thousand years of temperature shows that there has been a decline of 0.3 degrees per millennium over the that period.

Published in Nature Climate Change the paper finds that orbital forcings (essentially how close the sun and the earth are) are around four times as significant as CO2 emissions.

The reconstruction uses Maximum Latewood Density (MXD) rather than Tree Ring Width (TRW), the method used by the notorious Michael Mann Hockey Stick.

The authors are obviously painfully aware of the fraud practiced by Mann where he substituted instrumental records for proxies when the proxies didn’t show what he wanted (otherwise known as “Mike’s Nature trick”) as above their most significant graph they show how their records correlate with the temperature record up to the end of the reconstruction.

N-scan JJA temperature reconstruction and fit with regional instrumental data.

The tree rings are only from Sweden, which means that they aren’t global, but then neither was the Hockey Stick. Significantly for global warming models the Arctic regions are supposed to warm faster than the equator, so if there was unusual 20th Century warming it should show up here before many other places.

It also has implications for recent events in Queensland where the 12th International Coral Reef Symposium has been hearing how accelerating global warming is already affecting the Great Barrier Reef. On the basis of this they’re not facing anything they haven’t faced in recent geological time.


Posted by Graham at 8:25 am | Comments (6) |
Filed under: Uncategorized

July 10, 2012 | Graham

Julia is John? How to lose even more votes on refugees


Malcolm Turnbull made a debating point on refugees which has been taken up by Malcolm Farr, and apparently others like Virginia Trioli (based on Q&A last night), as being a viable strategy for the government to follow. Malcolm T must be laughing.

The suggestion is that Labor should just adopt John Howard’s policy and if the policy doesn’t work, then revert to something else.

If Gillard did that it might improve her refugee policy, but it would destroy her prime ministership.

No wonder Turnbull was quite happy to restate his challenge last night, although I have no idea why Chris Bowen on the same panel appeared to support it.

Labor, including Gillard individually, spent decades villifying Howard’s refugee policy, and the fact that they have now two-thirds adopted it is one reason for the defections of many of their left to the Greens.

Moving closer to Howard’s position would accelerate this.

It would also confirm the view of many on the right that the government stands for nothing, is hypocritical and incompetent.

It’s that reality that has seen Gillard do everything to avoid accepting the Nauru situation. She is completely wedged on the issue.

Worse, if as is likely the boats still continued to come, Scott Morrison would be able to point to the schemozzle and claim that it’s not just a matter of what the policy is, but whether people smugglers believe the government is really behind it.

It tells you something about the state of the ALP that Turnbull’s proposal is even being accepted as something viable for Labor. It’s only viable for the Liberals, and we’ll never know until after the election whether John Howard’s policies really can stop the boats now, whatever they may have done in the past.


Posted by Graham at 8:05 am | Comments (8) |
Filed under: Uncategorized

July 08, 2012 | Graham

Learning from California’s green economy


If you want to know the future of Australia under the carbon tax, look no further than California. In 2009 Julia Gillard was an unabashed fan of Republican Governor Arnold Schwarzenegger and his greening of the economy. Yet today that economy is one of the worst performing in the US, with worse to come.

A new study looks at the effect of the California Global Warming Solutions Act of 2006, otherwise known as AB32. As reported on IVN.US by Lucy Ma, while the government hasn’t released an official economic impact statement since 2010, the Californian Manufacturers and Technology Association has just commissioned one which predicts:

 the average California family will end up paying an additional $2,500 annually by 2020 when AB 32 is fully implemented. In addition, the state is expected to lose an additional 262,000 jobs, 5.6 percent of the gross state product, and a whopping $7.4 billion through decreased annual state and local tax revenues as a result. Figures from the study were based on more conservative estimates, suggesting that expected costs could actually range much higher.

It suggests the electricity hikes that Australians are facing are but a down payment on more pain down the track. It won’t matter that Whyalla is still there if the residents of it face this sort of additional cost.

Back in 2009 Gillard was interviewed on Lateline by Tony Jones as she visited California to learn what she could about creating jobs. At the time California, with an unemployment rate of 12.1%, was more than double the Australian rate at the time of 5.6% – Schwarzenegger should have been visiting us rather than vice versa.

TONY JONES: Yep. I’m sure we’ll hear more about that later. You’re in California to talk about jobs, in fact green jobs – the potential for green jobs in clean energy industries. How much of that potential can be translated back to the Australian economy? 

JULIA GILLARD: Well, I think a lot of that potential can be translated back to the Australian economy. We share a lot of things with California, I think. We’re parts of the world that have to worry about water scarcity, we’re parts of the world that have to worry about bushfires, and of course we’re parts of the world that are dealing with the challenge of climate change. What has been interesting coming here, Tony, is we have of course in California Governor Arnold Schwarzenegger, a Republican, from the conservative side of politics who has led the way here in California on climate change. He, seven years ago, as Governor, started in this state the move towards adapting this economy for climate change, the creation of the new green economy of the future. That stands in stark contrast to what the Liberal Party was doing back home with the former Liberal Government caught in climate change inaction and denial. California is synonymous, I think, in people’s minds with innovation, and we’ve certainly seen innovation here, innovation in the high-tech areas that are going to make a difference for climate change adaption. But we’ve also seen here in California bringing green skills and green training into the most traditional of occupations – plumbers and carpenters and electricians, and we saw that working in front of our very eyes at a technical college facility in LA today.

Australia and California are actually not dissimilar. While at USD $1.936 trillion their economy is slightly larger than ours which is AUD $1.57 trillion, we actually have a higher per capita income. Of course there are differences, one of which is their proximity to the largest consumer market in the world.

Addendum:

I’ve been accused of making an unrealistic comparison between Australian and California. When I did the post I only checked relative GDPs, but I had an image in the back of my mind of both economies and thought they were probably not dissimilar. As the table below shows, that is more or less correct. Mining and agriculture are more significant here, but both economies are essentially service-based.


Australia California
Agriculture and mining 10% 2%
Construction 8% 4%
Trade, Transportation and Utilities 7% 16%
Manufacturing 8% 10%
Information 3% 6%
Finance and insurance 10% 6%
Real estate 10% 17%
Professional and Technical Services 8% 9%
Education Health and other services 24% 18%

Note: The statistical categories are not necessarily defined the same way, so this is a bit of a guess in some cases. For example, California has an industry they call government, but we don’t appear to separate it out, and if we did it would represent around 25% of GDP, but would include a whole lot of activity to do with construction etc.

Sources: http://en.wikipedia.org/wiki/Economy_of_Californiahttp://www.abs.gov.au/ausstats/abs@.nsf/Lookup/by%20Subject/1301.0~2012~Main%20Features~Value%20of%20goods%20and%20services%20produced%20by%20Australian%20Industry~240http://en.wikipedia.org/wiki/Global_Warming_Solutions_Act_of_2006http://www.climatechange.gov.au/en/publications/projections/australias-emissions-projections/~/media/publications/projections/factsheet-emissions-projections.pdf


Posted by Graham at 4:53 pm | Comments (4) |
Filed under: Uncategorized

July 05, 2012 | Graham

Queensland health – doing less with more


In a previous post I pointed out that public service growth has far outstripped population growth. A couple of commenters, one from the trade union Together Queensland, suggested that the growth had been in the service sector, particularly health, education, child protection and police.

So I decided to investigate.

I don’t have a lot of time at my disposal for forensic analysis of public sector budgets, so I’ve just dipped into health a bit, and if money has been going into frontline health services, you have to wonder which ones.

Hospital beds are a generally accepted measure of service delivery in state health, which is primarily about hospital management, and searching on “Queensland growth hospital beds” Dr Google led me to this Courier Mail article with the headline “Queensland has fewest hospital beds per head of population in Australia, new report reveals”.

The Australian Medical Association released its annual public hospital analysis in Brisbane on Thursday, revealing Queensland has 2.4 beds for 1000 people – lower than the national average of 2.6.

The report card shows Queensland had 10,911 public hospital beds in 2009/10 – up 106 from the previous year.

AMA Federal president Steve Hambleton said that nationally, only 378 new beds were opened in 2009/10, about a tenth of what doctors believed were needed.

So, we’re doing worse than average, but we did open a few more beds per capita than the average of the other states, extrapolating from the last para.

Maybe we’ve always been below average and are just catching up.

Unfortunately not. The ABS has an extract from Regional Statistics Queensland 2000 which reveals that:

Queensland had a total of 15,939 hospital beds, in 1998-99. Of these, 10,643 beds were in public hospitals and 5,296 were in private hospitals (including day surgery hospital beds). The total number of hospital beds in Queensland represented 4.6 beds per 1,000 persons. This rate compares with 4.1 beds per 1,000 persons in New South Wales and 3.8 in Victoria.

So, in thirteen years hospital staff per capita has expanded, but hospital beds per capita has contracted. In 1998 we were 12% above NSW and 21% above Victoria yet in 2011 we are 8% below the national average.

The Costello Audit (pdf 6mb) provides an insight on p. 118 into how this trick might have occurred. While it has detailed analysis of the increase in salaries and capital expenditure combined with a decrease in efficiency the best illustration of the problem for me lay in its description of the cost of building a Queensland Children’s Hospital, which replaces services currently provided by the Mater and the RBH.

The initial cost of the hospital was estimated at $690 million. Since then, costs have more than doubled, to a revised figure of $1.5 billion, including the additional $80 million being expended on the Academic Research Centre, as shown in Chart 8.5.

Based on these latest cost estimates, the average cost per bed is around $4 million. However, in terms of incremental bed numbers, the cost rises significantly to more than $17.7 million per additional bed.

No wonder hospital bed numbers are going backwards in Queensland if they cost an effective $17.7 million each!


Posted by Graham at 11:12 pm | Comments (2) |
Filed under: Uncategorized

July 04, 2012 | Graham

Madness takes control at more levels than one.


Craig Emerson’s Karaoke Kamikaze was insane, but less insane than the argument that he was prosecuting on the carbon tax.

He also had the wrong song.

When I think of this government it’s Rocky Horror that comes to mind, not Horror Movie. 

While the minister’s performance was noteworthy on its own demerits, it is also symptomatic of the collective dysfunction of the government, and has attracted greater attention as a consequence.

As Riff Raff, Magenta and Columbia sing:

It’s astounding, time is fleeting
Madness takes its toll
But listen closely, not for very much longer
I’ve got to keep control

There might be 15 months to go, but as every day passes the realisation sinks in, at least subliminally, that nothing is really going to change, and that Tony Abbott is in control. This in turn leads to even more extreme attempts by the government to assert control, or to assert that they are in control.

Government members are worried that they’ll be “a jump to the left” followed by a “step to the right”, and might as well never have been. Quelle horreur!

Emerson’s performance may not have been as embarrassing as this NZ politician’s KKK and Black Face one, but he is a senior cabinet minister and advisor to the PM.

And he has staff to keep him out of trouble, at least in theory.

But the dysfunctionality of the Ghetto-Blaster Catastrophe is nothing compared to the irrational argument that the government is running on the Carbon Tax.

One the one hand the tax is said to change everything leading to a future nirvana of green jobs and a move away from “dirty polluting” ones, and on the other it is said to change nothing, leaving cities like Whyalla and Gladstone untouched.

So which is it? If the carbon tax is to work, then heavy industry, including steel and aluminium manufacture (particularly aluminium which consumes so much electricity in its smelting that it has been described as almost “pure electricity”) are destined to close down.

In the absence of a baseload, non-fossil-fuel derived alternative, of which nuclear is the only one likely to be available in any sort of reasonable (say 20 year) time span, that is the point of the carbon tax,.

If it doesn’t close down Whyalla and Gladstone, or at least substantially damage their economies, then carbon emissions will proceed apace.

You can’t have it both ways. A government that knew what it was doing, and was in control would know that. It would be out selling the tax and admitting that Tony Abbott is right – things are going to change, and that is the point.

We all know that is the point. By denying it the message the government broadcasts is that it doesn’t believe in its own policy, surely a sign of madness.

I’m not sure that there is a coherent explanation of the Time Warp lyrics, but when you’re pinned against the next election and Abbott won’t let you out of your corner, and no-one’s going to ring the bell, it must be tempting to want to slip back into another dimension – to “fantasy free me/So you can’t see me…”.

Running a government looked so easy back 2007, 2008 and 2009. Not anymore, and Craig Emerson is not the only one showing the strain.


Posted by Graham at 10:50 pm | Comments (2) |
Filed under: Uncategorized